Crypto Excel » Crypto Education » Technical indicators
Technical indicators
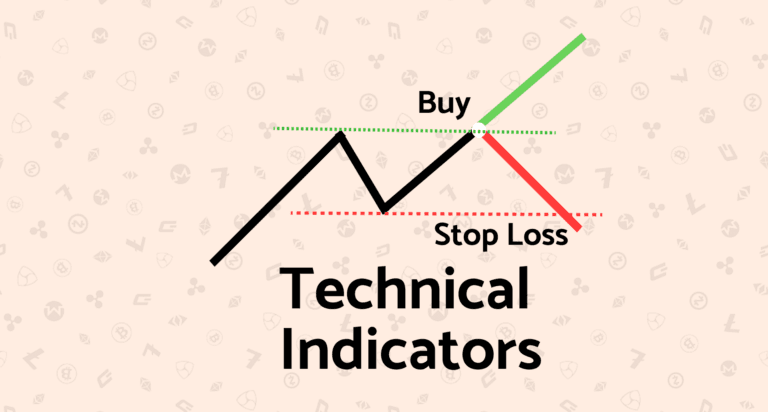
Understanding technical indicators
Technical indicators are mathematical calculations based on the price, volume, or open interest of a security, primarily used in the analysis of market trends. They serve as vital tools for traders and investors, helping to identify potential future price movements through historical data. The primary purpose of technical indicators is to simplify decision-making processes by providing clear and actionable signals regarding market conditions, thereby enhancing trading strategies.
If you want to know the difference between technical and fundamental analysis read this article
Technical indicators categories
There are several categories of technical indicators, each serving specific purposes in market analysis.
One of the best website to look for articles and information about technical indicators is Investopedia.
Crypto Excel offers more then 100 technical indicators which can be grouped in the following categories.
Candels
Candlestick analysis focuses on individual candles, pairs or at most triplets, to read signs on where the market is going. The underlying assumption is that all known information is already reflected in the price. The technique is usually combined with support & resistance. A candle body reflects the net price movement between open and close while the wicks show reversals that occurred within the timeframe of the candle.
Common candlesticks that are used in this analysis are dojis, spinning tops, hammers, engulfing candles, pinbars and inside bars.Crypto Excel supports the following 64 candle technical indicators:
- 2crows
- 3blackcrows
- 3inside
- 3linestrike
- 3outside
- 3starsinsouth
- 3whitesoldiers
- abandonedbaby
- advanceblock
- belthold
- breakaway
- closingmarubozu
- concealbabyswall
- counterattack
- darkcloudcover
- doji
- dojistar
- dragonflydoji
- engulfing
- eveningdojistar
- eveningstar
- gapsidesidewhite
- gravestonedoji
- hammer
- hangingman
- harami
- haramicross
- highwave
- hikkake
- hikkakemod
- homingpigeon
- identical3crows
- inneck
- inside
- invertedhammer
- kicking
- kickingbylength
- ladderbottom
- longleggeddoji
- longline
- marubozu
- matchinglow
- mathold
- morningdojistar
- morningstar
- onneck
- piercing
- rickshawman
- risefall3methods
- separatinglines
- shootingstar
- shortline
- spinningtop
- stalledpattern
- sticksandwich
- takuri
- tasukigap
- thrusting
- tristar
- unique3river
- upsidegap2crows
- xsidegap3methods
- Heikin-Ashi
- Z Score
Momentum
Another significant category is momentum indicators, which measure the speed of price movement and are instrumental in determining the strength of a trend. Indicators like the Relative Strength Index (RSI) and Stochastic Oscillator fall into this category. These tools can signal potential reversals by highlighting overbought or oversold conditions in the market, indicating that a price correction might be imminent.
Crypto Excel supports the following 41 momentum technical indicators:
- Awesome Oscillator
- Absolute Price Oscillator
- Bias
- Balance of Power
- BRAR:
- Commodity Channel Index
- Chande Forecast Oscillator
- Center of Gravity
- Chande Momentum Oscillator
- Coppock Curve
- Correlation Trend Indicator
- Directional Movement
- Efficiency Ratio
- Elder Ray Index
- Fisher Transform
- Inertia
- KDJ
- KST Oscillator
- Moving Average Convergence Divergence
- Momentum
- Pretty Good Oscillator
- Percentage Price Oscillator
- Psychological Line
- Percentage Volume Oscillator
- Quantitative Qualitative Estimation
- Rate of Change
- Relative Strength Index
- Relative Strength Xtra
- Relative Vigor Index
- Schaff Trend Cycle
- Slope
- SMI Ergodic
- Squeeze
- Squeeze Pro
- Stochastic Oscillator
- Stochastic RSI
- TD Sequential
- Trix
- True strength index
- Ultimate Oscillator
- Williams %R
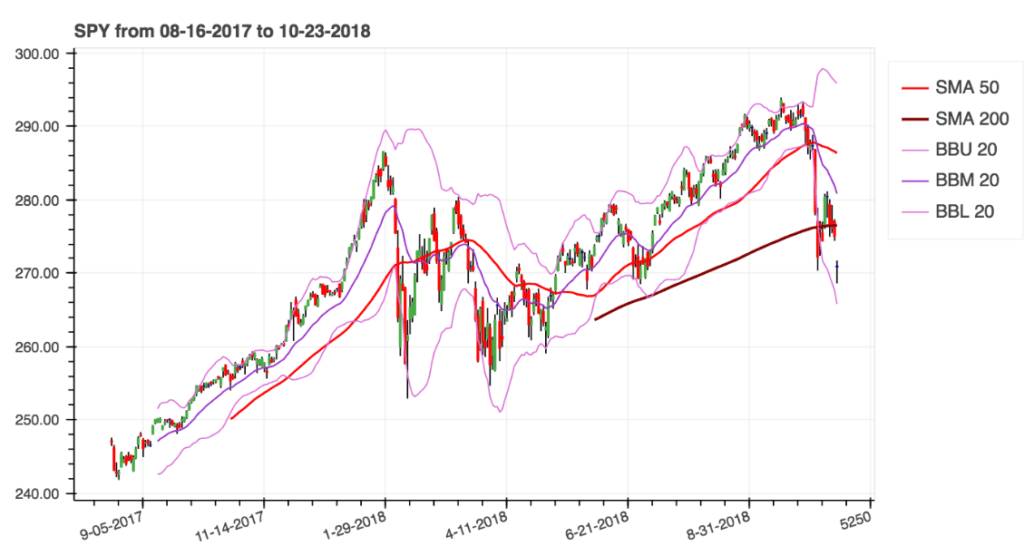
Overlap
Overlap Technical indicators use the same scale as prices and are plotted over the top of the prices on a chart.
Crypto Excel supports the following 33 overlap technical indicators:
- Arnaud Legoux Moving Average
- Double Exponential Moving Average
- Exponential Moving Average
- Fibonacci’s Weighted Moving Average
- Gann High-Low Activator
- High-Low Average
- High-Low-Close Average
- Hull Exponential Moving Average
- Holt-Winter Moving Average
- Ichimoku Kinkō Hyō
- Jurik Moving Average
- Kaufman’s Adaptive Moving Average
- Linear Regression
- McGinley Dynamic
- Midpoint
- Midprice
- Open-High-Low-Close Average
- Pascal’s Weighted Moving Average
- WildeR’s Moving Average
- Sine Weighted Moving Average
- Simple Moving Average
- Ehler’s Super Smoother Filter
- Supertrend
- Symmetric Weighted Moving Average
- T3 Moving Average
- Triple Exponential Moving Average
- Triangular Moving Average
- Variable Index Dynamic Average
- Volume Weighted Average Price
- Volume Weighted Moving Average
- Weighted Closing Price
- Weighted Moving Average
- Zero Lag Moving Average
Statistic
Statistic technical indicators use statistic calculation based on price history.
Crypto Excel supports the following indicators:
- Entropy
- Kurtosis
- Mean Absolute Deviation
- Median
- Quantile
- Skew
- Standard Deviation
- Think Or Swimm Standard Deviation
- Variance
- Z Score
Trend
The primary purpose of trend indicators is to identify the dominant market trends.
Crypto Excel Supports the following 18 indicators
- Average Directional Movement Index
- Archer Moving Averages Trends
- Aroon & Aroon Oscillator
- Choppiness Index
- Chande Kroll Stop
- Decay
- Decreasing
- Detrended Price Oscillator
- Increasing
- Long RunParabolic Stop and Reverse
- Q Stick
- Short RunTrend Signals
- TTM Trend
- Vertical Horizontal Filter
- Vortex
- Cross Signals
Volatility
Volatility technical indicators quantify the degree of variation in trading prices over a specific period, allowing users to gauge the intensity of price fluctuations.
Crypto Excel supports the following 14 volatility indicators
- Aberration
- Acceleration Bands
- Average True Range
- Bollinger Bands
- Donchian Channel
- Holt-Winter Channel
- Keltner Channel
- Mass Index
- Normalized Average True Range
- Price Distance
- Relative Volatility Index
- Elder’s Thermometer
- True Range
- Ulcer Index
Volume
Volume technical indicators provide context to price movements. When analyzing price changes in the context of volume, traders can better determine if a price increase is supported by strong buying interest or if it is merely a result of low trading activity. High volume accompanying a price increase often signifies a strong bullish trend, while a price increase on low volume may suggest weakness in the trend. Conversely, a price decline with high volume can indicate selling pressure, validating bearish sentiment.
Crypto Excel supports the following 15 Volume Technical indicators
- Accumulation/Distribution Index
- Accumulation/Distribution Oscillator
- Archer On-Balance Volume
- Chaikin Money Flow
- Elder’s Force Index
- Ease of Movement
- Klinger Volume Oscillator
- Money Flow Index
- Negative Volume Index
- On-Balance Volume
- Positive Volume Index
- Price-Volume
- Price Volume Rank
- Price Volume Trend
- Volume Profile