Crypto Excel » Crypto Education » AI Trading

What is AI Trading?
Artificial intelligence (AI) is one of the most used words these days, but what is AI trading? How can AI be integrated into trading decisions? Is it something new or just a rebranding of an old concept? In this article, we will present an example of using AI to predict the Apple stock price. We’ll use Excel, an application you’re probably familiar with and have installed on your PC. But don’t worry. We won’t use any VBA code or go into any difficult technical details. This is just a basic example of how AI trading works and we need real numbers to illustrate theoretical concepts. You can download the Excel file at the link at the end of the article so you don’t have to worry about formulas. Please remember that this article is not intended as personal financial advice.
AI Trading definition.
AI trading integrates the capabilities of artificial intelligence into an algorithmic trading system. AI trading bots are able to process a large amount of technical and fundamental market data in real time. By training a model based on historical market data and financial news, including social media posts, the AI uses various machine learning techniques to recognize patterns that can predict price movements and generate trading signals.
While that’s a good definition of AI trading, it doesn’t really shed much light on how it works, and you’re probably still a bit confused. It still sounds like… a new mathematical way to make money with stocks and cryptocurrencies. Read on and it will become clearer to you.
Excel AI for trading signals.
Let’s now focus on this part of the above definition of AI: “training a model on historical market prices to recognize patterns that can generate profitable trading signals.”
We want to predict the Apple price in the short and medium term, so we need:
- Historical daily prices of Apple,
- A model: we will use technical indicators,
- A machine learning method to train our model: We will use a genetic algorithm.
Spoler. Excel has a genetic algorithm available called Solver.
How to get Apple historic prices.
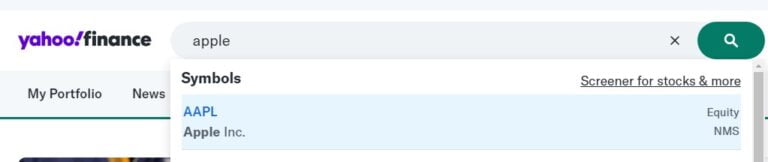
The easiest way to get historic prices for almost every stock or crypto, for free, is using Yahoo finance.
Go to Yahoo finance website and type Apple in the search box. Unfortunately Yahoo has had a recent user interface update so you have to use the old Yahoo interface. the link provided should get you to the right version.
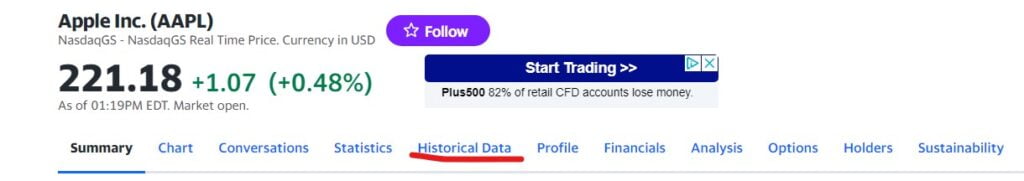
Now click historical data.
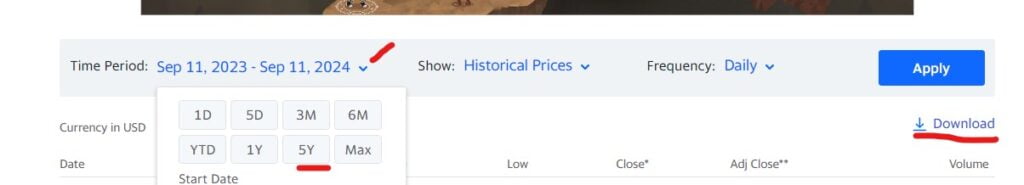
Finally select 5 years and click download.
Build the model.
For us, a model is a description of the evolution of Apple prices based on mathematical concepts.
A predictive model uses indicators or proxies to predict the desired outcome.
Technical indicators are mathematical calculations based on historical price, volume or open interest information that help traders predict price movements in the financial markets. They are mainly used in technical analysis to recognise patterns and make informed decisions about entry and exit points. If you want to know more about technical indicators, you can read this article.
Technical analysis has been around for more than 100 years. Since Charles H. Dow (after whom the Dow Jones Index is named) published his theory in 1902.
That’s why there are thousands of models and I decided to ask ChatGPT which is the most used technical indicator.
“While the most effective indicator can vary based on individual trading styles, the Moving Average is often regarded as the most utilized technical indicator. Its simplicity in tracking trends makes it popular among both novice and experienced traders. By smoothing out price fluctuations, it helps in identifying the general direction of the market.”
Our model will be a simple moving average crossover.
We buy a share of Apple when the fast moving average is above the slow one, and we go short for the same amount when the crossover is in the opposite direction.
Moving average is calculated on the closing price so the that buy and sell happens at the open price of the next bar.
Slow Moving Average is calculated over a longer period of time compared to a faster moving average. It is called slow because it react slower to changes in the market than faster moving averages.
In the next section, we will create the model in Excel. We won’t go into too much detail about the programming, but if you want, you can skip the paragraph and download the file directly from the link at the end of the article.
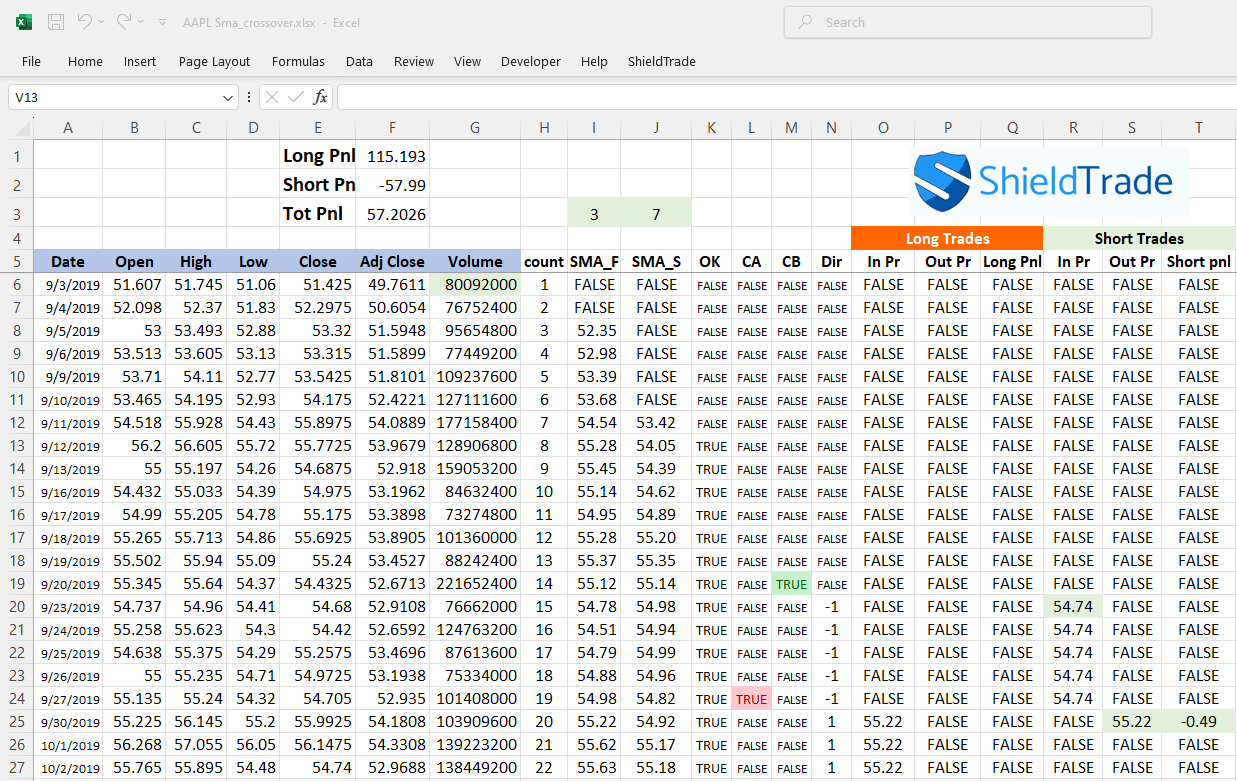
The Excel model.
Open the csv file previously downloaded with Apple historic prices of the last five years.
Name cell I3 SMA_F and cell J3 SMA_S. We will enter the length of the fast and slow moving average in those cells.
Column H: Counter.
Count the number of data (Bars).
Column I: SMA_F.
I6=IF(H6>=SMA_F,AVERAGE(OFFSET(E6, 0,0,-1*SMA_F,1))).
If there are enough data Calculate the average of the closing prices in column E. The OFFSET formula makes the range dynamic so that we can change it when changing the SMA_F in cell I13.
Column J: SMA_S.
J6=IF(H6>=SMA_S,AVERAGE(OFFSET(E6, 0,0,-1*SMA_S,1))).
Same as above using SMA_S for the range definition.
Column K: Ok.
K6=AND(I5<>FALSE,J5<>FALSE, I6<>FALSE, J6<>FALSE).
This formula will return TRUE if this row and the previous one have a valid average calculated. OK = TRUE is mandatory for all other calculations.
Column L: CA.
L6=IF(K6,AND(I5<J5,I6>J6)).
Return TRUE If OK is TRUE and a cross above happened (SMA_F was lower then SMA_S in the previous row and it is higher in this row).
Column M: CB.
M6=IF(K6,AND(I5>J5,I6<J6)).
If OK is TRUE return TRUE if a cross below happened (SMA_F was higher then SMA_S in the previous row and is lower in this row).
Column N: Dir.
N6=IF(K6,IF(L5,1,IF(M5,-1,N5))).
When OK is TRUE return 1 if a CA happened in the previous row, return -1 if there was a CB in the previous row. If there were no CA or CB in the previous row return the previous value of this column. When we have a change in direction we close the previous position and we open a new one in the opposite direction.
Column O: In Price for long trades.
O6=IF(N6=1,IF(N5<>1,B6,O5)).
If OK is TRUE and there was a change in direction (ex. from -1 to 1) in the previous row, return the opening price of this row. Otherwise return the previous value if DIR is 1 or FALSE if Dir is -1.
Column P: Out Price for long trades.
P6=IF(N6=-1,IF(N5=1,B6)).
When DIR is -1 (short) and there was a change in direction (from 1 to -1) from the previous row: return the opening price of this row. Otherwise return FALSE.
Column Q: Long Pnl.
Q6=IF(P6<>FALSE,P6-O5).
If we have an out price in this row calculate the Pnl (exit pr – entry pr).
Column R, S, T.
R6=IF(N6=-1,IF(N5<>-1,B6,R5)).
S6=IF(N6=1,IF(N5=-1,B6)).
T6=IF(S6<>FALSE,R5-S6).
Short trades are equivalent to long trades.
Copy and past the above formulas down to the last row.
Finally let’s sum the Pnl ranges for long and short.
F1, F2, F3.
Long Pnl: F1=SUM(Q6:Q1263).
Short Pnl: F2=SUM(T6:T1263).
Tot Pnl: F3=F1+F2.
Train the model.
Now that our crypto Excel model is ready, it’s time to train it. Try to modify the value in the green cells, the SMA lengths, and you will see that the Pnl changes.
We want to get the highest possible total Pnl (F3).
This is a very simple model, so we can achieve our goal manually. In the figure, at the SMA lengths of 3 and 7, we already have a positive total Pnl of 57 USD. If we only make the long trades the model shows a profit of 115 USD. But Excel has a built-in function that can improve the work for us: it’s called Solver.
The Excel solver.
The Excel Solver is a powerful tool in Microsoft Excel that helps the user to find optimal values for formulas based on constraints. It is primarily used for optimization problems that involve maximizing or minimizing a value while adhering to certain user-defined limits.
If you have never used this add-in before you need to load it first.
Go to File > Options
Click Add-Ins, and then in the Manage box, select Excel Add-ins.
Click Go.
In the Add-Ins available box, select the Solver Add-in check box, and then click OK.
Notes:
If the Solver Add-in is not listed in the Add-Ins available box, click Browse to locate the add-in.
If you get prompted that the Solver Add-in is not currently installed on your computer, click Yes to install it.
After you load the Solver Add-in, the Solver command is available in the Analysis group on the Data tab.
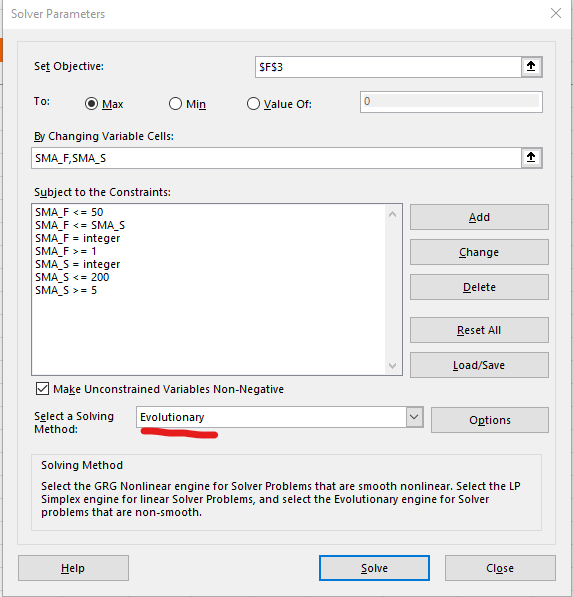
We want to maximize cell F3: Total Pnl; by changing the SMA parameters with the following constraints.
- SMA_F must be an integer number between 1 and 50,
- SMA_S must be an integer number between 5 and 200,
- SMA_F must be lower then SMA_S.
Remember to choose the Evolutionary method which uses the genetic algorithm approach to find optimal solutions.
Conclusion.
After the solver is done the optimized moving average lengths are 2 and 16, the total Pnl is 218 USD.
That’s it. You have just created your first AI trading algorithm.
I hope this long read has helped you understand the basics of AI trading, but read on, the following section is perhaps the most important.
Is AI trading something new?
The whole process of sourcing data, backtesting and optimizing the result, can be called AI trading. To be honest, I think this is nothing really new. Platforms like Tradestation or MT4 have been offering their retail and institutional clients this capability for a long time. What is really new is the increase of computing power and the proliferation of APIs (software mediators that allow applications to communicate with each other).
Ai trading, nowadays, is an indispensable instrument for all the institutional and professional retail traders.
Can this model be improved?
Our simple model can be improved with other time frames or technical indicators, we could also consider fundamental analysis and the price of other stocks that correlate with Apple. If we want to trade cryptocurrencies, evaluating media sentiment by reading Twitter, posts and watching multiple crypto exchanges simultaneously in real time can also increase our Pnl a lot. A quantum computer can do all this in the blink of an eye.
Does AI Trading makes money?
This is a very important question.
Please keep in mind that this article is not intended as personal financial advice, it is for educational purposes only.
It is definitely not enough to use PNL as the only metric to train a model. We should at least consider the number of trades, the drowdown, the profit factor and the sharp ratio. But the most important issue is that in the financial world
“Past performance is no guarantee of future results”. Don’t assume that an investment will do well in the future just because it has done well in the past.
Nevertheless, AI trading offers huge benefits and today almost 80% of all trades are generated by computers. Some of the most important benefits are:
- getting rid of emotions in trading,
- maintaining a disciplined strategy,
- avoid overtrading,
- monitor several assets at the same time.
Crypto Excel. A Python Excel Add-in for AI trading
Python is one of the most widely used programming languages for API communication, trading and AI development. But it’s not as simple as Excel is.
That ‘s why we decided to develop Crypto Excel: A Python Excel Add-in that connects Excel to your crypto exchange in real time.
Our mission is to make crypto asset data and professional Python trading libraries available to anyone with a basic Excel knowledge.
Crypto Excel supports more than 100 exchanges.
You can now use professional Python trading libraries and build your AI trading platform without any coding knowledge with simple Excel formulas.
Public data such us real time books, trades, OHLCV are available without having to register on the Exchange, therefore, after installing Crypto Excel, you can start creating a personalized crypto Excel sheet for your needs.
Simple for beginners and powerful for advanced crypto traders Crypto Excel can be used to solve many issues facing investors, portfolio managers, traders, analysts, auditors, accountants and students.